
Overview
This guide walks through what the newly upgraded Return Report can do and how to use it — helping you quickly pinpoint return problems, understand the reasons, and get actionable improvement suggestions.
Available platforms: Newegg.com, Neweggbusiness.com, Newegg.ca
1. What this report helps you do
Letting you complete the loop from “spotting the problem” to “knowing how to fix it” on a single page.
- See the big picture — your store’s overall return rate, trend, and whether you’re meeting the target, all at a glance.
- Pinpoint specific products — which SKUs have high returns and large return amounts, and are worth fixing first.
- Understand return reasons — messy return reasons are grouped into 6 “fixability” buckets, clearly telling you which ones you can fix and which are on the buyer/logistics side and can’t be changed.
- Get down-to-earth improvement suggestions — AI, based on your own return data, gives you an action list of “what’s most worthwhile to fix first,” each item backed by evidence, with one-click jumps to edit the listing / view quality detail.
- Hear the customer’s voice — return notes and product reviews are shown right in the product detail, so you don’t have to look elsewhere.
In one sentence: find out which products drive returns, why, and specifically how to improve.
2. Quick start: understand your returns in 3 steps
Step 1 · Check the Store Overview — go to Seller Portal > Analytics > Return Report. The report opens on “Store Overview” by default. Look at the 4 cards at the top: how much you sold, how much was returned, whether your return rate meets the target, and how many returns are “addressable.”
Step 2 · Read the AI Action Plan — the “AI Action Plan” on the right of the overview tells you directly the top 3 things worth fixing first in your store, and which returns require no action.
Step 3 · Drill down to specific products — switch to the “SKU Analysis” tab. The list is sorted by “loss-prevention priority” by default. Click “Detail ’” on any product to see whether it’s worth your attention, how much you’re losing, whether it’s fixable, and how urgent it is — along with targeted suggested actions.
3. Interface overview
The report consists of 1 page-header filter area + 2 tabs:
| Tab | Purpose |
|---|---|
| Tab 1 · Store Overview | Store-wide: KPI cards + return trend + return reason distribution + AI Action Plan |
| Tab 2 · SKU Analysis | Product-level: filters + table + export; click in to see single-product detail |
4. Store Overview
4.1 KPI cards
| Card | Main metric | Notes |
|---|---|---|
| Return scale | Total returns + return amount | With refund / replacement share breakdown |
| Return rate | Return rate % | With performance target status, and comparisons vs. previous period and year over year |
| Addressable share | Addressable return share % | Share of returns caused by fixable reasons such as Listing Info / Product Quality / Wrong Item Shipped |

The performance target status has three tiers, measured against the Seller Performance return-rate target line (currently 5%):
- Meets target: return rate ≤ 5%
- Over target: return rate > 5% and < 10%
- Critical: return rate ≥ 10%
There are two comparison bases: vs. previous period (current period vs. the immediately preceding window of equal length) and year over year (vs. the same period last year, removing seasonal effects).
4.2 Return trend chart
A single combo chart displays multiple dimensions at once:
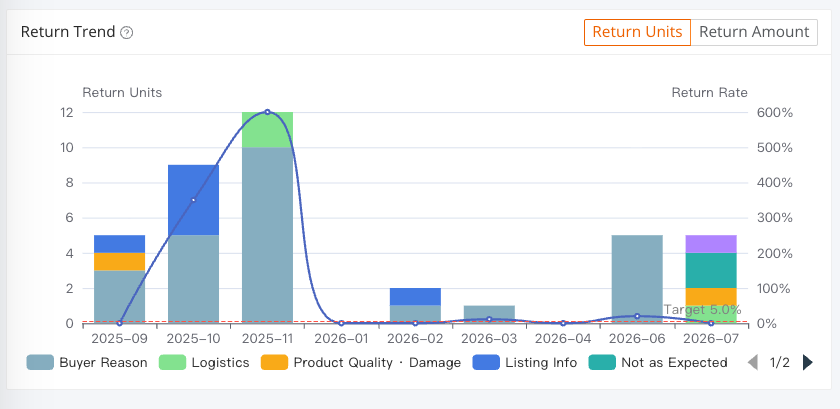
- Stacked bars = return volume of each return-reason bucket over time; the bar unit can be toggled between units / amount.
- Line (right axis) = return rate. Note: the return-rate line is always “return orders ÷ sales orders” and does not change when you toggle the bar unit.
- Red dashed line = the 5% performance target line; when your return-rate curve is below it, you’re meeting the target.
- Hovering over a point in time shows that period’s total (units / amount), the breakdown by reason bucket, and the return rate.
This helps you quickly judge whether a rise in returns during a period is a product issue.
4.3 Return reasons (by fixability)
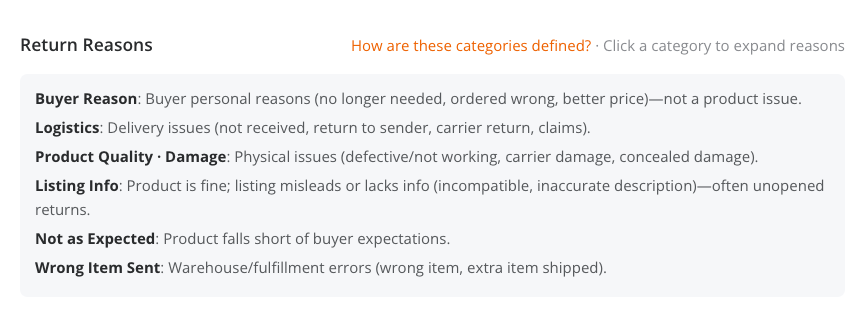
This section groups all return reasons into 6 “fixability” buckets, ordered by share. Each bucket shows “share + how many SKUs it affects.”
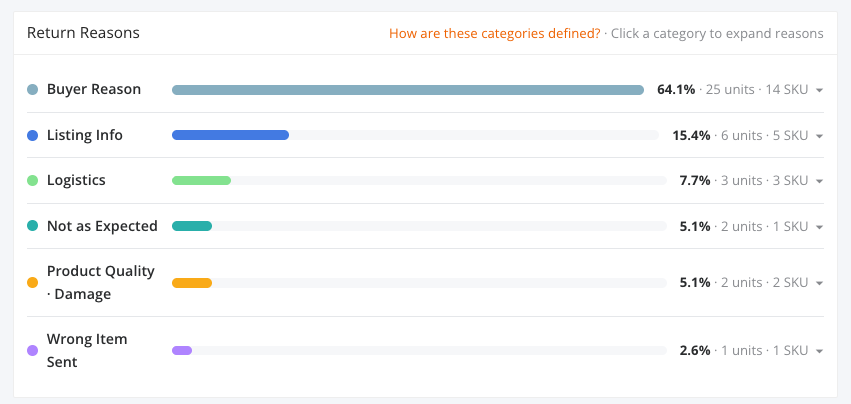
| Bucket | Meaning | Can you fix it? |
|---|---|---|
| Wrong Item Shipped | Warehouse/fulfillment execution error (wrong item, extra item shipped) | Fixable |
| Product Quality & Damage | Physical issue with the item (defective/not working, transit damage, concealed damage) | Fixable |
| Logistics | Delivery stage (not received, return to sender, carrier return, claims) | Mostly uncontrollable |
| Buyer Reasons | Buyer’s personal reasons (no longer needed, ordered wrong, found a better price) — not a product issue | Not fixable |
| Below Expectations | The product falls short of the buyer’s expectations | Soft signal |
How to use it:
- Click any bucket row to expand and see which specific return reasons it contains; each reason shows the number of affected SKUs and its share.
- Inside the expanded area there’s a “Filter this bucket in SKU Analysis ’” link that jumps to the SKU Analysis tab with that bucket filter applied, so you can see exactly which products are involved.
- The “How are these categories defined?” link at the top-right of the card expands the full definitions of the 6 buckets.
4.4 AI Action Plan
The AI section on the overview page, based on your store’s return data, generates the top 3 loss-prevention levers most worth prioritizing. Each includes:
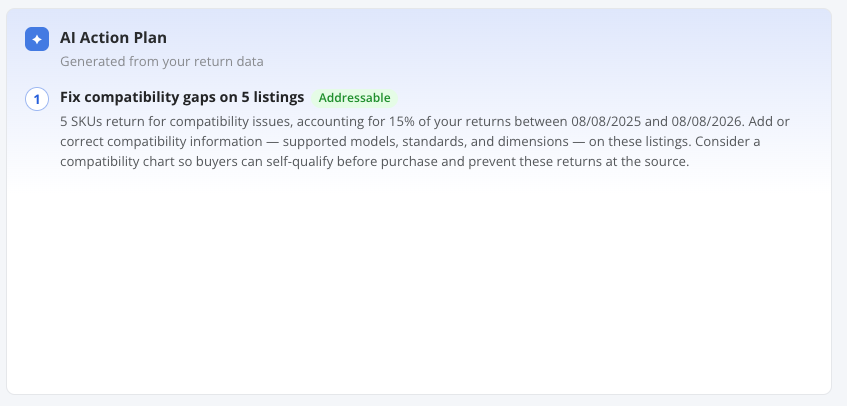
- A title + a “Fixable / Partially fixable” tag
- A plain-language explanation of what the problem is and why it’s worth fixing
- Evidence: real numbers such as share and how many SKUs are affected
It also explicitly lists the “no action needed” portion, for example: “No action needed: 27% is ‘no longer needed / found a better price’ — buyer-side, not a product issue.” This way you won’t waste effort on returns you can’t change. How the AI works and how trustworthy it is are detailed in Section 8.
5. SKU Analysis
Switch to the “SKU Analysis” tab to see every product that had returns within the selected time range (including delisted products that still had returns). Also you can view the return details by clicking View Detail.
5.1 Reading the table columns
| Column | Notes |
|---|---|
| Channel | The channel of returns this period: SBS / SBN; if both channels have returns, shows SBS / SBN (dual tag) |
| Return rate | The product’s return rate; if there is no sales denominator under the selected channel, shows “—” rather than 100% |
| Return orders / total orders | Return orders / total sales orders (helps you judge the statistical significance of the return rate) |
| Refund / Replacement | Breakdown of refund orders / replacement orders |
| Return amount | The amount involved in the product’s returns |
| GMV | The product’s sales in the selected time window |
| Main reason | The top return reason (specific reason name + colored dot of its bucket; hover shows the bucket name) |
| Product quality | Listing product-quality tier: Excellent / Good / Poor / Unrated |
| Rating | Product-review star rating + score (one decimal) |
| Action | “Detail ’” opens the product’s return detail |
Tip: about 84% of products had only 1 return in a given period. If you only look at the return rate (1 return / 1 order = 100%), it’s easy to be misled by a small sample. The “total orders” column helps you judge whether the rate is truly meaningful.
5.2 Sorting
Sorted by “Return rate” by default: focusing on high-return-rate products (returns ≥ 2 orders), by “return amount” from high to low. Sorting by return rate, return units, and return amount is also supported. The list uses server-side pagination, so even large sellers with thousands of SKUs over a long period can page through smoothly.

5.3 Export to Excel
Click “Export to Excel” to export the full list per the current filters (unpaginated), with columns matching the interface — convenient for offline analysis or for communicating with your team/suppliers.

6. SKU return detail
Click “View Detail ’” in the list, and a return-detail drawer slides out on the right, organized to help you decide in 3 seconds whether a product needs attention, then know how to fix it.

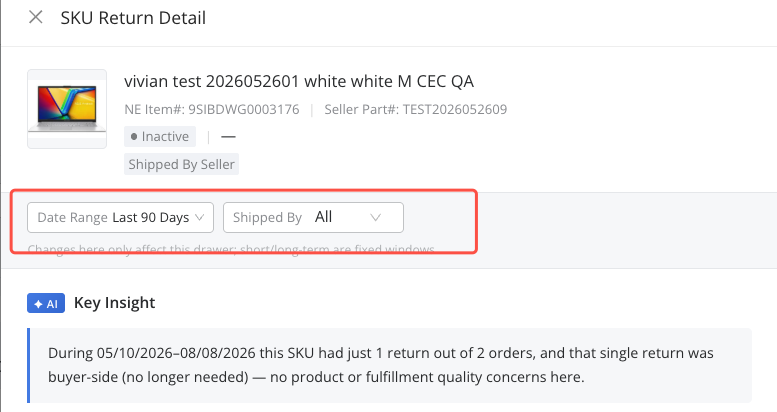
6.1 Drawer-level filters
At the top of the drawer are independent time-range + ship-by filters, which follow the page-header global filters by default but can also be adjusted separately (affecting this drawer only). Note: the short-term / long-term rate in the decision card use a fixed scope (rolling back 3 months / 12 months) and are not affected by these filters.
6.2 One-sentence summary (AI)
A one-sentence AI conclusion at the top directly points out why this product is mainly being returned, what to fix first, how much room there is to fix it, and whether the trend is worsening or improving. For example: “This SKU is mainly returned for compatibility/description issues (62%+20%, mostly returned unopened) — buyers decide to return just from the listing. Fix the listing first; there’s plenty of room to improve and the problem is worsening.”
6.3 Does it need attention? (Decision card)
| Metric | The question it answers |
|---|---|
| Return-loss amount (return orders / total orders) | How much are you losing? Is the loss large? |
| Share of returns from fixable reasons | Can it be fixed? Is there room to improve? |
| Short-term rate (last 3 months) vs. long-term rate (last 12 months) | Is it urgent? Worsening or improving? |
A line below the card shows the refund / replacement breakdown in order counts and amounts. The category-average comparison is shown only when there are enough active sellers in the same category to protect seller privacy; otherwise the decision card judges only against the 5% target line.
6.4 Return reasons
Presented by fixability bucket, consistent with the Store Overview, but with the specific reasons within each bucket expanded by default. Each reason shows its order count + share, recalculated per the selected time range.
6.5 Return trend
A combo chart for this product: stacked bars of reason buckets + a return-rate line, with the bar unit toggleable between units / amount.
6.6 Suggested actions (AI)
For the dominant fixable reasons, it gives down-to-earth actions and evidence one by one, with one-click quick entries — for example, checking that title/description/specs match the physical product with a quick link to Edit Listing, reviewing the quality-score details to locate the low-scoring dimension with a link to open quality detail, or verifying recent batch quality with your supplier. For non-fixable reasons (buyer-side / logistics-side), the AI clearly marks “not a product issue, no action needed,” so you don’t waste effort.
6.7 Customer feedback
Two sections present the customer’s own words directly: Return notes (the reason description the customer filled in when returning) and Product reviews (title, overall comment, pros, cons, star rating, and review date, with a rating-distribution overview). Both sections support “View all” for paged browsing.